2023 Women’s World Cup Travel Data - Which Fans Cover The Most Ground

Women’s football has been steadily rising in popularity over the last number of years and the 2023 FIFA Women’s World Cup is a hotly anticipated affair. Fans from across the globe, in particular for the 30 traveling nations, will travel in their droves to Australia and New Zealand this July.
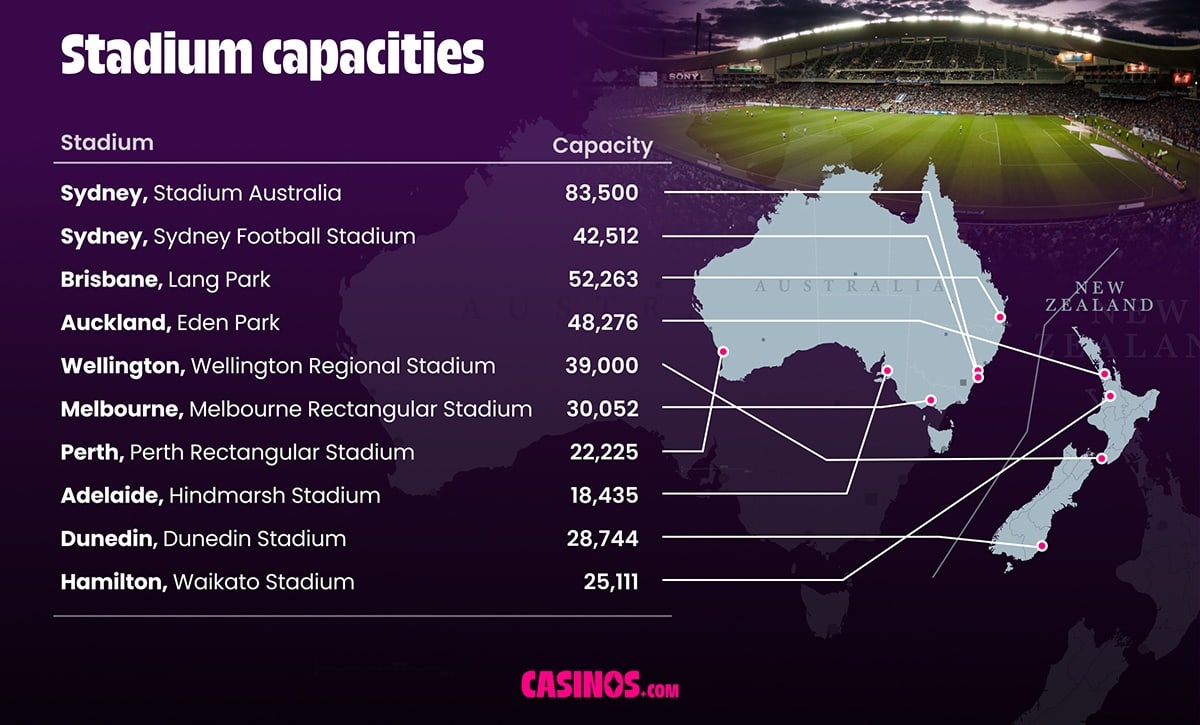
A total of ten venues are due to host group games, with the first match kicking off between New Zealand and Norway at Eden Park in Auckland on July 20. The final round of 48 group games will take place on August 3rd before the knockout rounds begin.
Games will be spread across 10 different venues from nine cities - four in New Zealand and six in Australia. It’s the first senior FIFA tournament to be held in Oceania. With the 10 stadiums spread out across two countries and vast areas of land, some traveling fans will have to cover more ground than others to watch their beloved nations compete for glory.
With that in mind, the researchers at Casinos.com decided to delve into the figures to find out which fans will travel the most - and the least - at this year’s Women’s World Cup if they want to watch all three of their nation's group games. As well as that, we tallied the total capacity available to fans based on the stadiums hosting their nation’s play group fixtures.
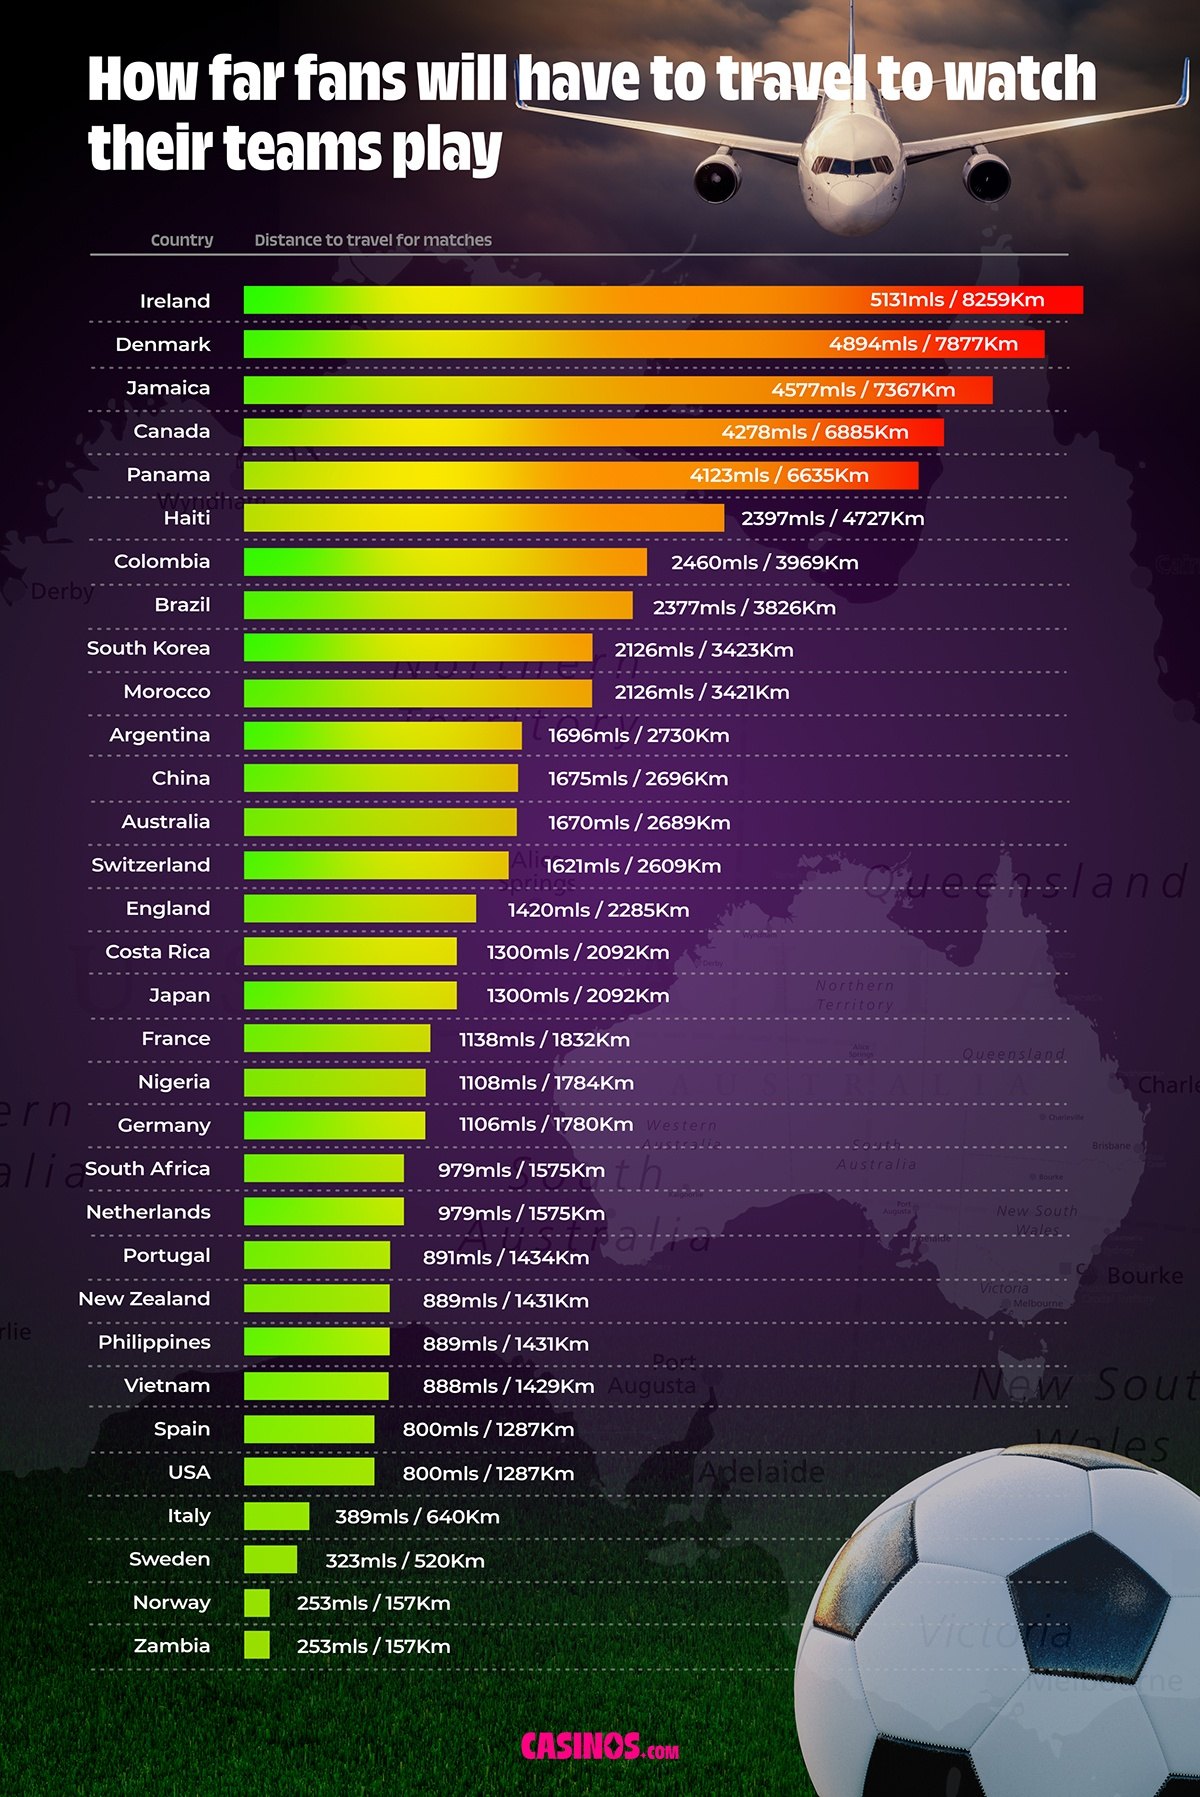
Research uncovered that Irish fans will have to travel the furthest to watch their team play, covering a distance of 8,259km (5,131 miles) to cheer on the girls in green. Some solitude for Irish fans, however, will be that the stadiums they play in over the course of the three games hold the second-largest total capacity at 157,988 - second only to the USA. On average, fans will have to travel 2,877km (1,787 miles) across their nation's group games, meaning Irish fans have 2.8 times the distance to coverage than the average traveling fan.
Denmark, Jamaica, Canada, and Panama all have to consider making their way across or around the Australian outback and will cover huge distances in their own right. Unfortunately for their fans, however, they aren’t compensated by large capacity numbers with their totals falling below the average (107,695) in this regard.
Favorites for the tournament the United States have a relatively short distance to cover for their group games, with just 800 miles (1,287km) to travel. While this is a benefit for the fans, the players too will have more time to recover and have to spend significantly less time travelling than many of their opponents. Their neighbors to the north, however, haven't been quite as lucky. Team Canada will cover 4,278 miles on their World Cup journey, the fourth most of any team.
In fact, many of the teams that betting and casino sites believe have the highest chances of winning travel less than the average team including Spain, England, France, Germany and hosts Australia.
Raw Data
Methodology
- We measure the distance for each team using Google Maps to calculate the total miles and kilometers for each team traveling from their first group game, directly to their second and lastly their final fixture of the group stages.
- Finally, we calculated the total stadium capacity available to each nation's traveling support.
Sources
Meet The Author
Experience

Colm Phelan has spent several years working in the iGaming industry and has plenty of experience when it comes to writing, researching and rigorously testing online casinos and sportsbooks. While Colm has invested a lot of his time into the digital marketing world but his other passions include poker and a variety of sports including golf, NFL and football.
Read Full BioTest Your Luck
Not Your Spam Filter
Sign up to receive emails and promotions from Casinos.com